Class 1E Geography
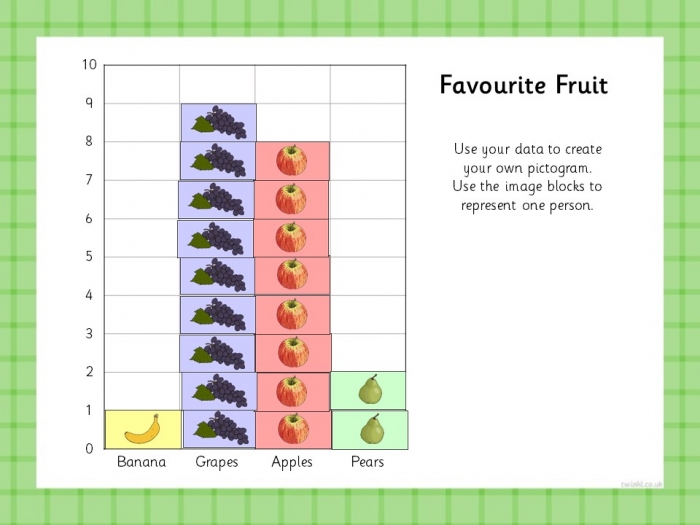
Class 1E have been learning about how data or information can be sorted and represented this week. In Geography, we looked at the benefits of using pictograms to give a visual representation and allow us to clearly see which category has the highest and lowest numbers. In what turned into a passionate debate on our favourite fruits, with apples and grapes running neck and neck for most of the way, grapes pipped apples to the post right at the end. This learning was then transferred into representing data collected in a house styles survey where the children made their own pictogram.
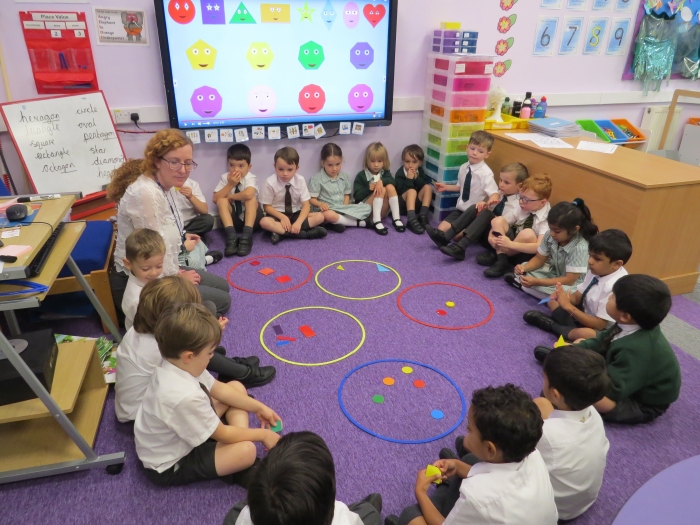
In maths, we continued sorting and representing data looking at properties of 2D shapes and seeing how many different ways we could sort them into categories. A venn diagram was introduced in order to solve the problem of some shapes falling into two categories of colour and number of sides.
 View Gallery